
Gapminder
Fact-based foundation providing interactive bubble charts and educational tools to dismantle misconceptions about global health and wealth.
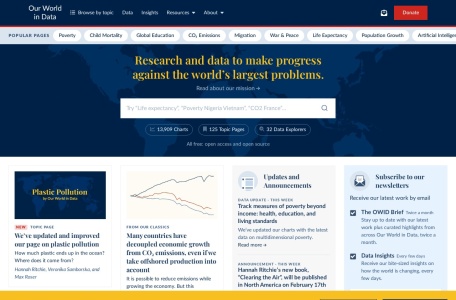
Open-access scientific publication visualizing global problems and progress across health, poverty, climate change, energy, and education.
Our World in Data is an independent, non-profit scientific web publication based at the University of Oxford. Dedicated to making research and data on the world’s largest challenges understandable, it combines empirical global data with interactive charts covering poverty, disease, energy, hunger, climate change, and demographic shifts.
Data comes from peer-reviewed academic journals, specialized research institutes, and international organizations like the UN, WHO, World Bank, and OECD.
Yes. All charts and data are licensed under CC BY, meaning you can freely reuse, adapt, and publish them with attribution to the authors.
It is published by Global Change Data Lab, a UK charity funded through grants from charitable trusts, foundations, and individual reader donations.