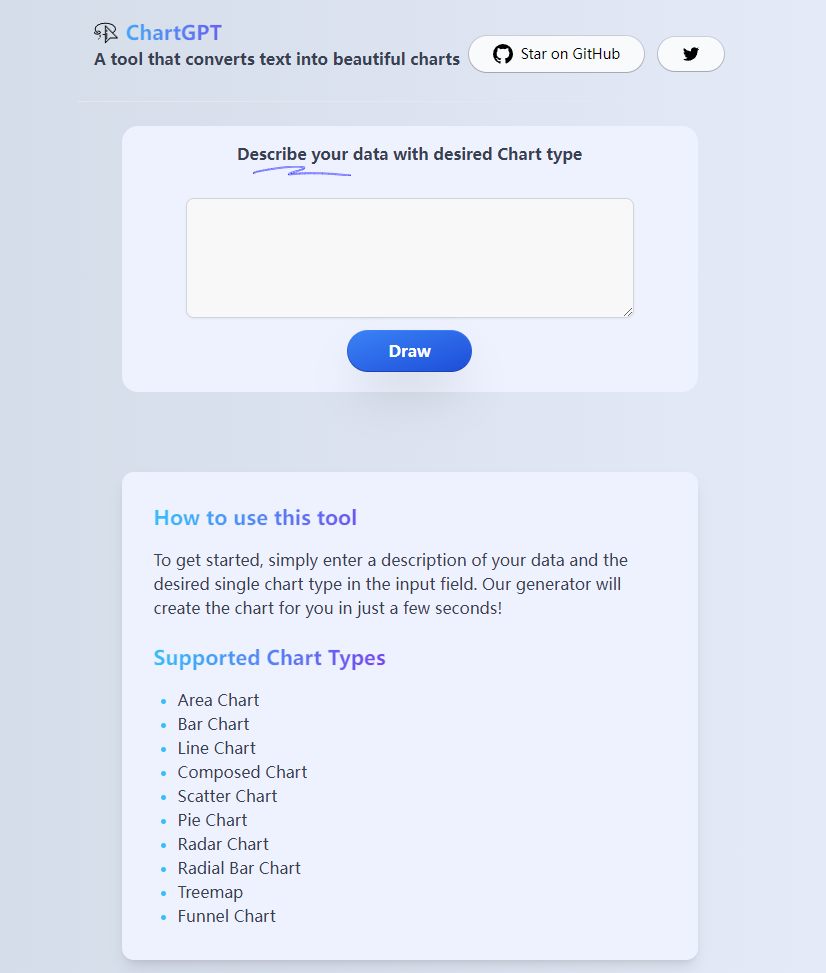


ChartGPT is a tool that converts text into beautiful charts. It uses a natural language interface to generate charts from simple descriptions of data and chart types. You can use ChartGPT to create various kinds of charts, such as area, bar, line, pie, radar, and more. ChartGPT is powered by GPT-4, a state-of-the-art language model that can produce fluent and coherent text based on a given input. ChartGPT is easy to use and can save you time and effort when you need to visualize your data quickly and effectively.

数据统计
相关导航
暂无评论...
