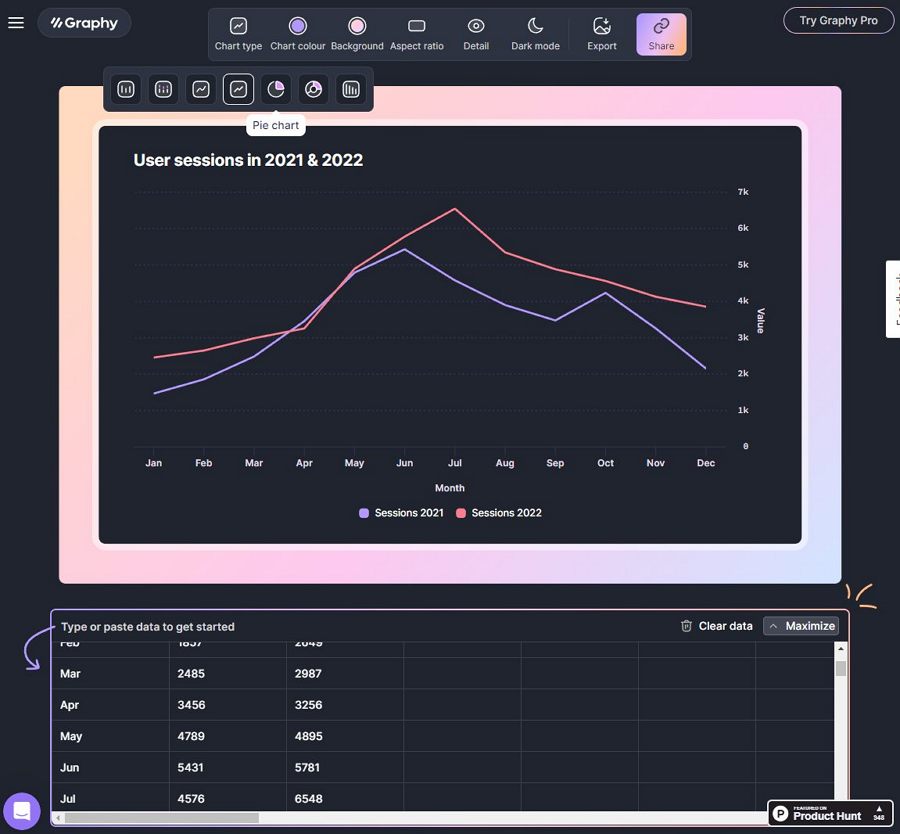


Graphy is a new platform that allows you to create and share interactive data visualizations with ease. Whether you want to explore your own data, or showcase your insights to the world, Graphy can help you turn your data into beautiful and engaging stories.
With Graphy, you can:
– Connect to various data sources, such as Google Sheets, CSV files, APIs, and more.
– Choose from a wide range of chart types, such as line, bar, pie, scatter, map, and more.
– Customize your charts with colors, fonts, legends, tooltips, and more.
– Add interactivity to your charts with filters, sliders, buttons, and more.
– Embed your charts on any website or blog with a simple code snippet.
– Collaborate with others on your projects and share your charts with a unique link.

Graphy is designed to be easy to use for anyone, regardless of their technical skills or data literacy. You can create stunning data visualizations in minutes, without writing any code or installing any software. Graphy is also free to use for up to 10 projects and 100 charts.
If you are interested in learning more about Graphy, you can visit their website at https://graphy.new/ and sign up for a free account. You can also check out some examples of Graphy charts on their gallery page and get inspired by what others have created.
Graphy is a powerful and innovative tool for data storytelling. Whether you are a student, a teacher, a journalist, a researcher, or a business professional, Graphy can help you communicate your data in a clear and compelling way. Try it out today and see what you can create with Graphy!

